AWS IoT Analytics provides access to the results of a SQL query as a data set that you download using a pre-signed URL, but what if you want to export the results somewhere else automatically?
Although AWS IoT Analytics doesn’t contain this functionality natively, we can leverage the power of a triggered notebook container to achieve our desired outcome. For flexibility, in this example I’m going to use Amazon Kinesis Firehose to stream the data into S3 and in a future post we’ll look at how we can also use Firehose to stream the data into Redshift.
Http iframes are not shown in https pages in many major browsers. Please read this post for details.
That’s pretty straightforward.
Let’s take a closer look at the crux of the job, streaming the CSV out of IoT Analytics and putting JSON records into S3 via firehose.
stream = urllib.request.urlopen(dataset_url)
reader = csv.DictReader(codecs.iterdecode(stream, 'utf-8'))
rows=0
for row in reader:
    record = json.dumps(row)+"\n"
    response = firehose.put_record(DeliveryStreamName=streamName,Record={'Data': record})
This isn’t especially efficient as we are calling Put Record once for each row in our CSV, but it keeps the code simple. If we migrated to using Put Records instead, which is a batch API, it would be much faster but we would have to introduce complexity to keep the batch size within the limits.
All we need to do now is setup a container notebook triggered from the dataset execution in a similar way to how we did it in an earlier post and we’ll have the data set streamed into S3 on every execution.
You may be wondering why you can’t just do this with a Lambda function? You could, if you could trigger a Lambda function when the data set content has been generated, but that’s not currently possible 🙁
IoT Analytics is great for doing analysis of your IOT device data on a regular cadence, for example daily or hourly. Faster scheduled analysis is possible, and the minimum scheduling frequency was lowered to 15 minutes in August this year, but what if you want something near real-time? Although there isn’t a built in feature for this, if you just want to setup a basic alarm or build some straightforward near real-time dashboards, there’s a simple solution using the power of the IoT Analytics Lambda Activity coupled with AWS CloudWatch.
Messages from my devices flow into AWS IoT Analytics from a number of MQTT topics that are all routed to a Channel using Rules that I’ve setup with AWS IoT.
Data flowing into a Channel passes through a Pipeline before reaching the Datastore and this Pipeline is the key to getting our near real-time metrics.
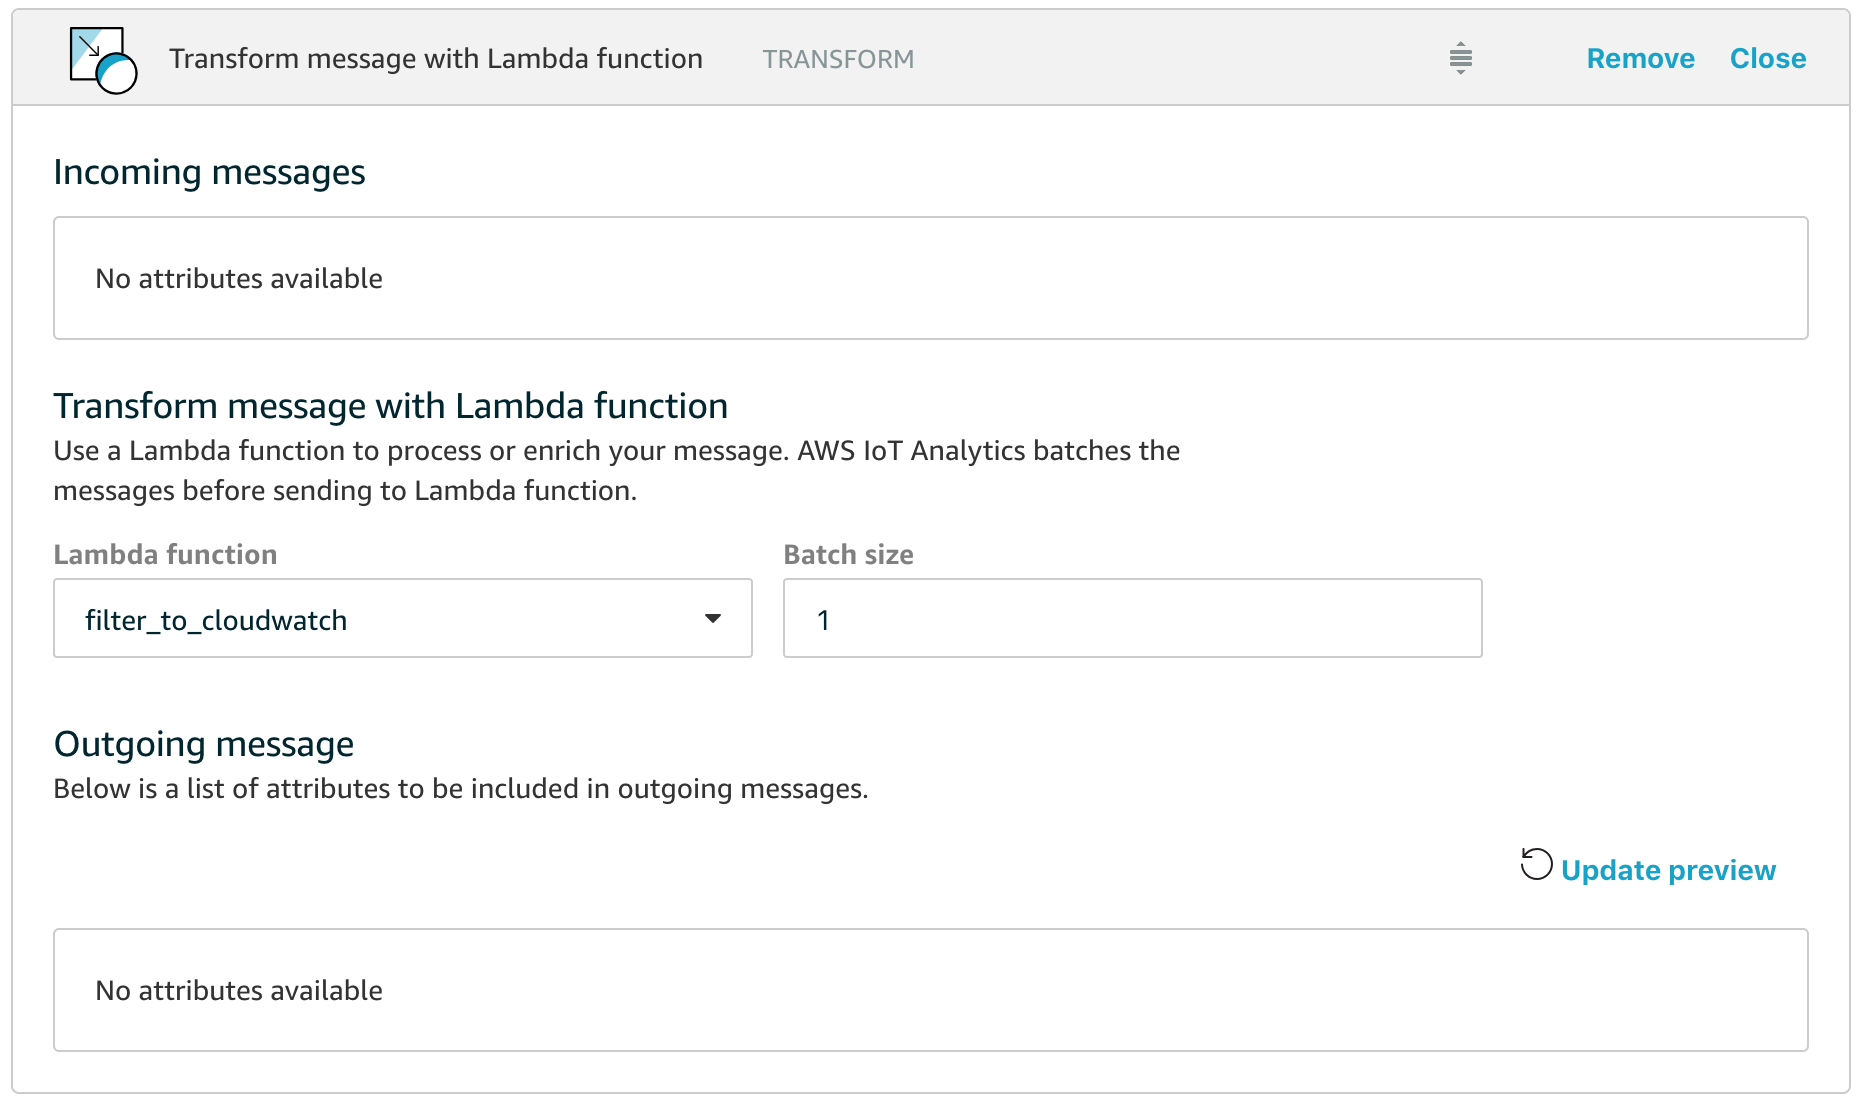
The Lambda Activity in AWS IoT Analytics
All we have to do is add a Lambda function into our Pipeline and have the Lambda function route appropriate data to AWS CloudWatch so that we can then use all the features of CloudWatch for building our dashboards, configuring alarms and combining our new custom metrics with data from other sources. In the example above, I’ve named the Lambda function filter_to_cloudwatch and let’s take a closer look at how simple this function can be.
import json
import boto3

def cw(topic,value,name):
 cloudwatch = boto3.client('cloudwatch')
 cloudwatch.put_metric_data( MetricData=[
 {
  'MetricName': name,
  'Dimensions': [{'Name': 'topic','Value': topic}],
  'Unit': 'None',
  'Value': value
 }],Namespace='Telescope/Monitoring-Test')
 return

def lambda_handler(event, context):
 for e in event:
  if 'uptime' in e :
   cw(e["full_topic"],e["uptime"],"uptime")
  if 'illumination' in e :
   cw(e["full_topic"],e["illumination"],"illumination")
  if 'temperature' in e :
   cw(e["full_topic"],e["temperature"],"temperature")
 return event
Yes, that is all of the code, it really is that short.
Hopefully the code is self-explanatory, but in essence what happens is that the Lambda function in a Pipeline is passed an array of messages with the size of the array dependent on the batch size that you configure for the activity (the default of 1 means that the Lambda function will be invoked for each individual message, which is fine for scenarios where messages only arrive in the channel every few seconds).
The handler then loops through all the messages and looks to see if the message has attributes for uptime, illumination or temperature – these are the attributes that I want to graph in near real-time in this example. If the attribute exists in the message, we call the cw() function to emit the custom metric to AWS CloudWatch.
Note that the Lambda function simply returns the messages that it received so that they flow through the rest of the Pipeline.
Probably the biggest gotcha is that you need to make sure you have granted IoT Analytics permission to invoke your Lambda function, and you can do this with the following simple AWS CLI command.
If you forget this, and you have configured your logging options, you’ll see error messages like this for your cloudwatch log stream aws/iotanalytics/pipelines
[ERROR] Unable to execute Lambda function due to insufficient permissions; dropping the messages, number of messages dropped : 1, functionArn : arn:aws:lambda:us-west-2:<accountid>:function:filter_to_cloudwatch
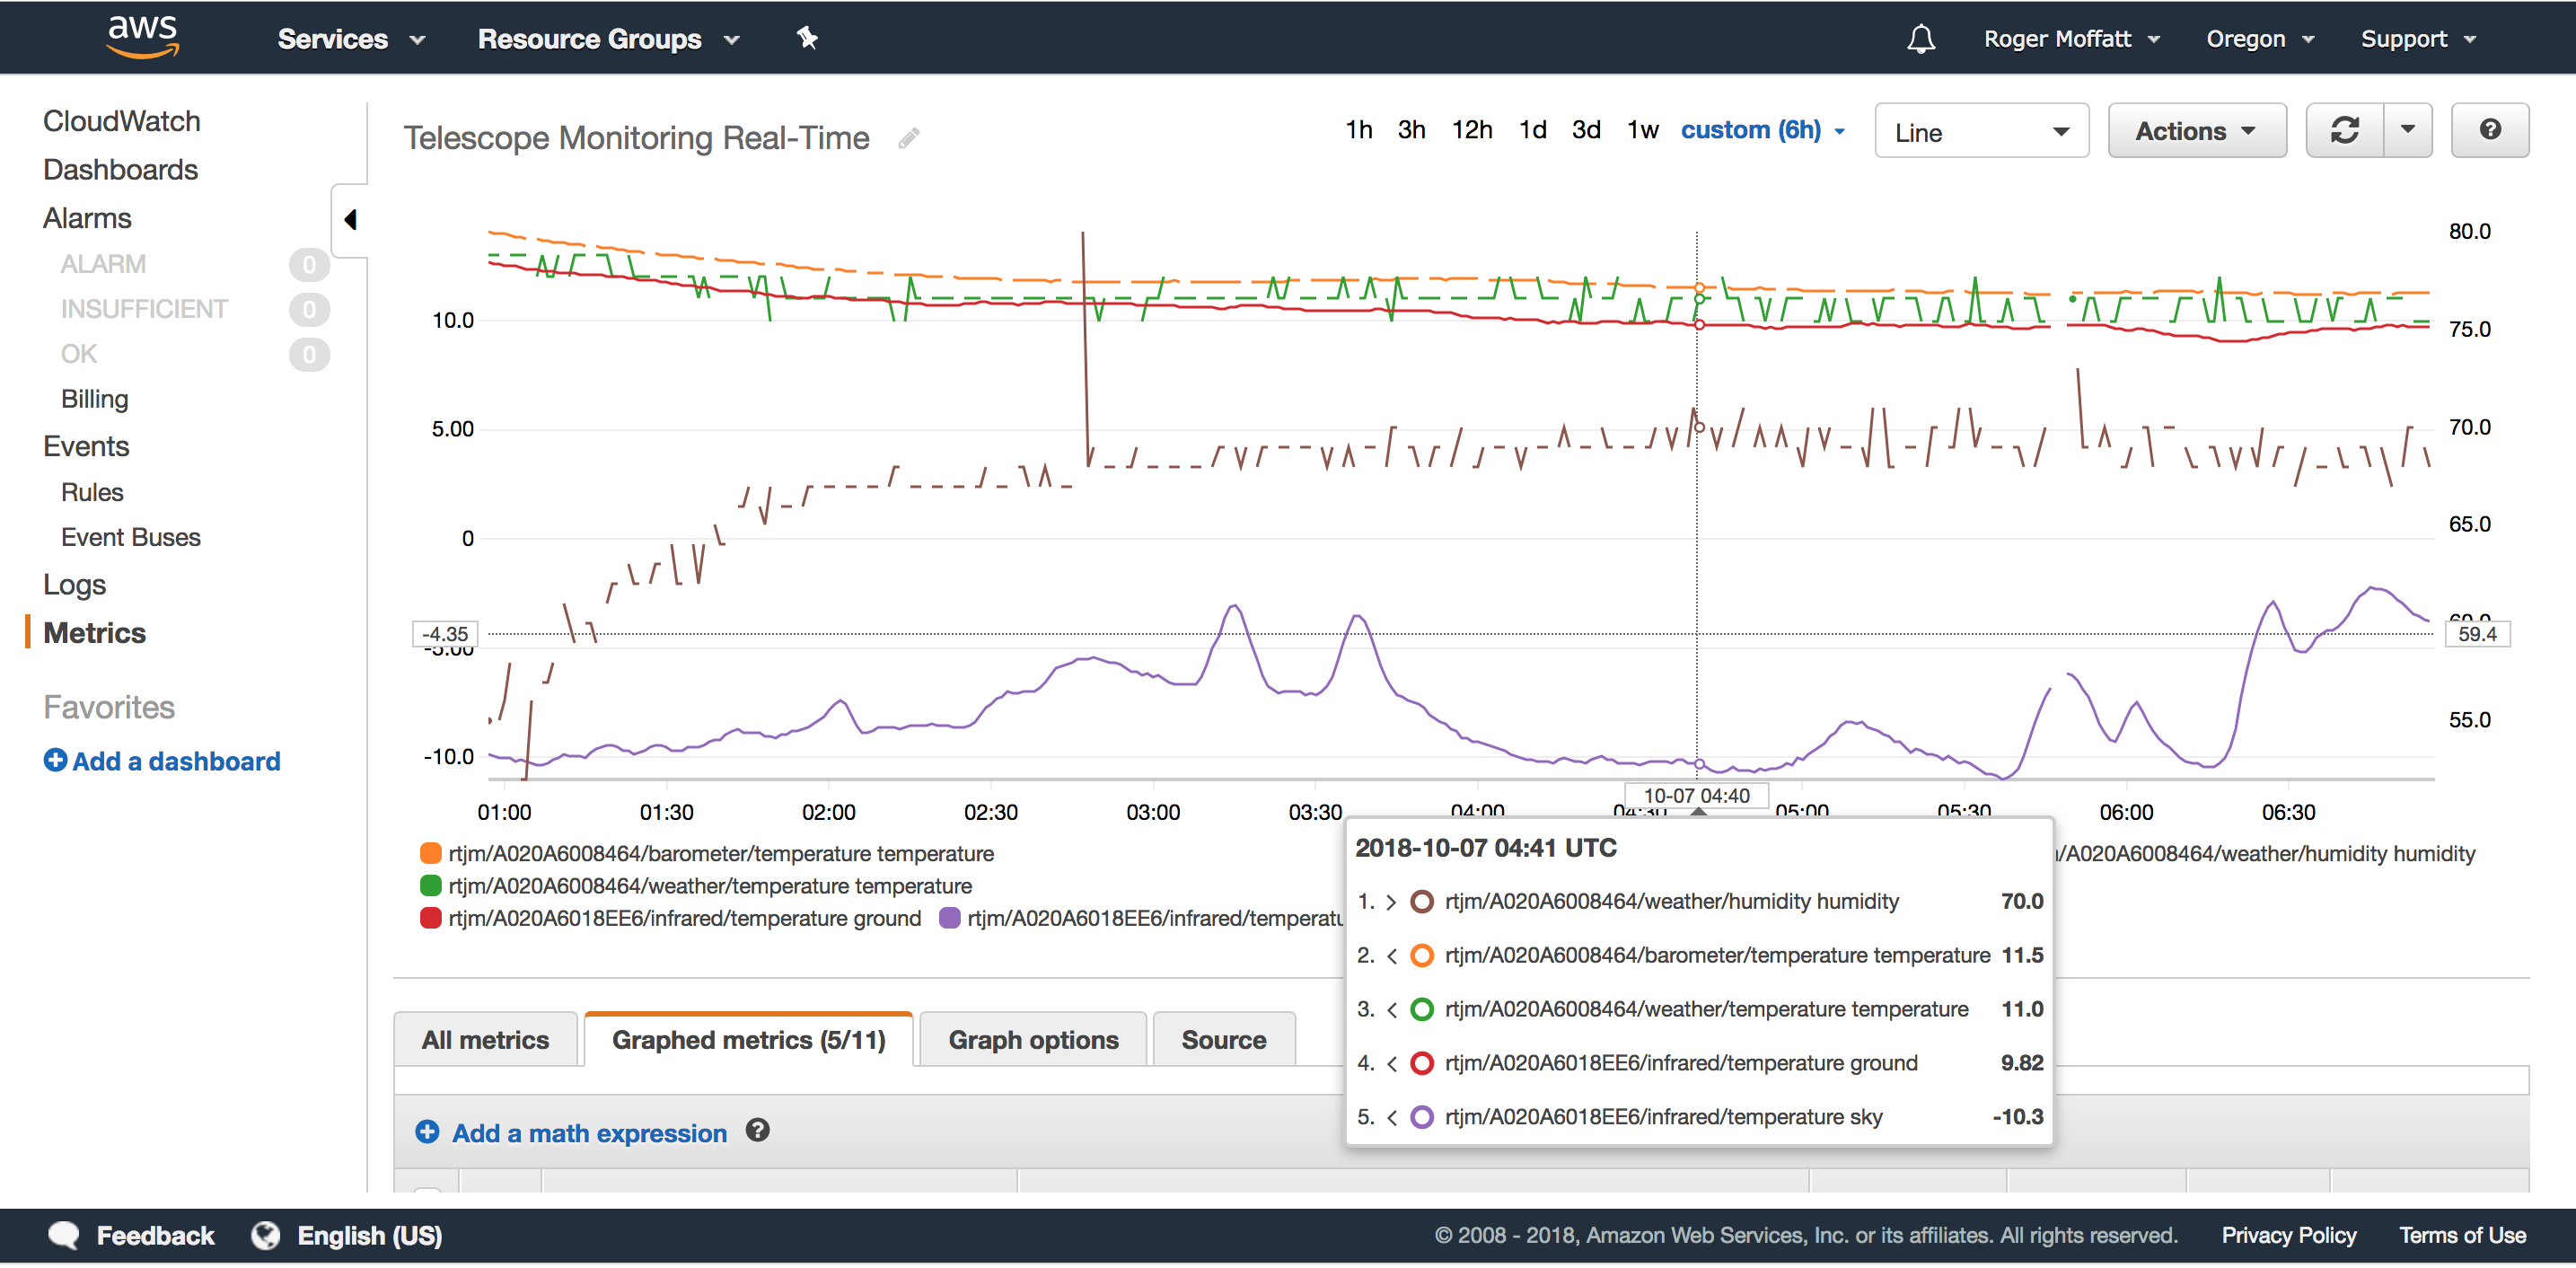
And that’s it! We can now use all the loveliness of AWS CloudWatch to plot our custom metrics on graphs and dashboards with fine grained time resolution, for example this is a graph of my data every 30 seconds.
Example real-time metrics from the IoT Analytics Pipeline showing in CloudWatch
In conclusion, we’ve seen that with a little lateral thinking, we can leverage the Lambda Activity that is available in the AWS IoT Analytics Pipeline to route just the message attributes we want to a near real-time dashboard in AWS CloudWatch.
We discussed previously how to get data out of your data store by writing SQL queries to produce data sets in CSV format. What about exploring and visualising that data to make insights easier? In this post I’ll talk about the native integration between AWS IoT Analytics and Amazon QuickSight that makes this possible and fun.
First, let’s take a quick look at one of my dashboards.
This shows a variety of data about some of the sensors located in our garden (the locations on the map are not real) and as you can see it does a decent job of visualising the data at hand – but where does that data actually come from?
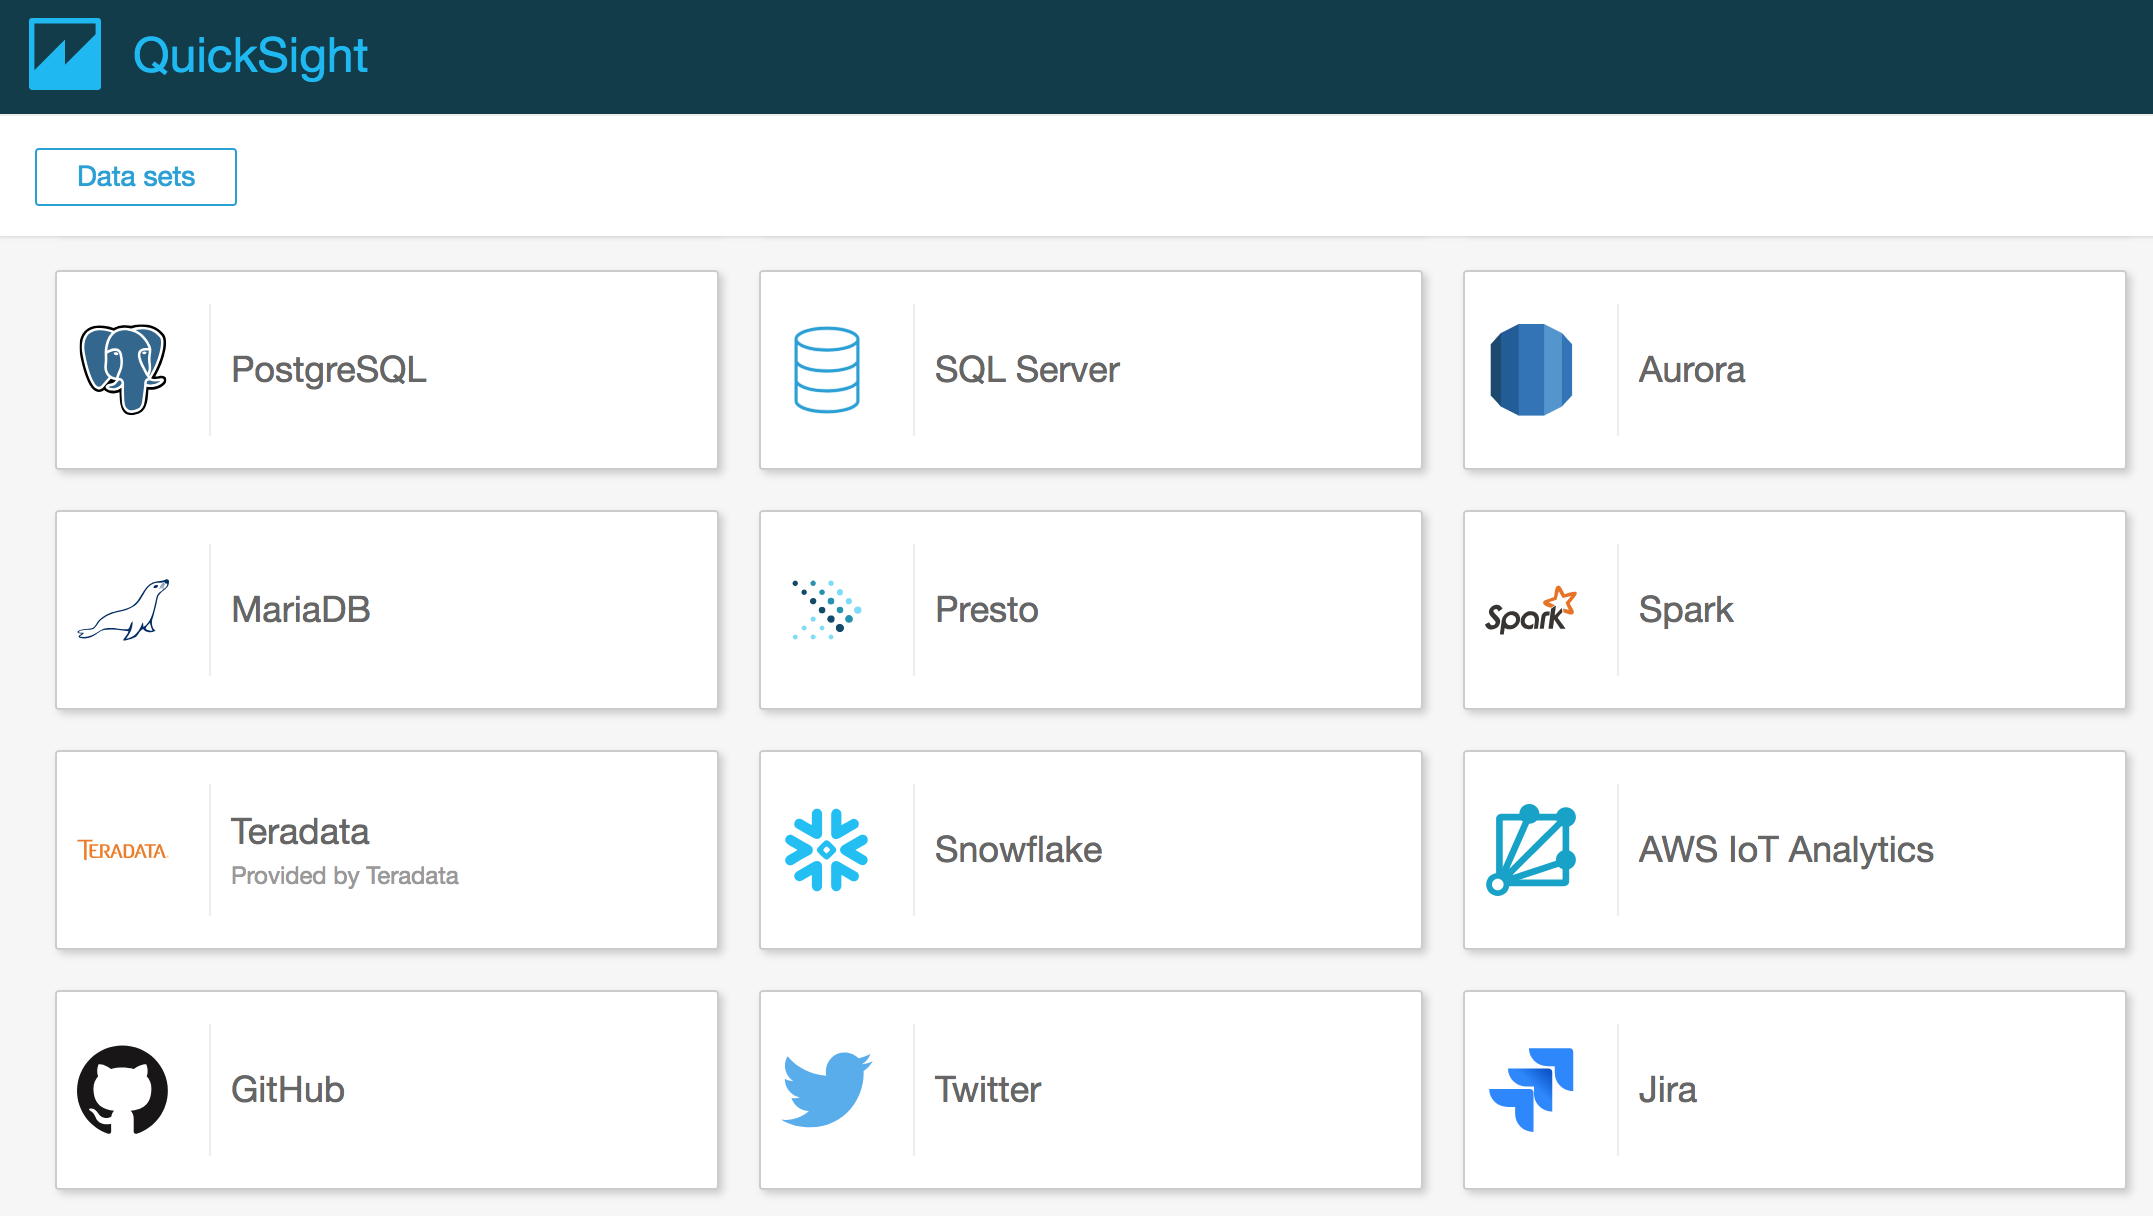
QuickSight has native support for AWS IoT Analytics Datasets and so your starting point is to create a new QuickSight Dataset using the Data Source selection page that looks like this.
Once you’ve selected a data set in IoT Analytics (remember, a data set is the result of a SQL query against the data store) you have some pretty nice data preparation tools in QuickSight that let you alter column types and even create new calculated columns – and this is an especially useful feature as you can, for example, take a unix timestamp and convert it into a date time object that QuickSight can use as the x-axis on many of your graphs. I wrote more about this here.
Notice how the co-ordinates are returned as an array of two strings where each string contains a decimal degrees value.
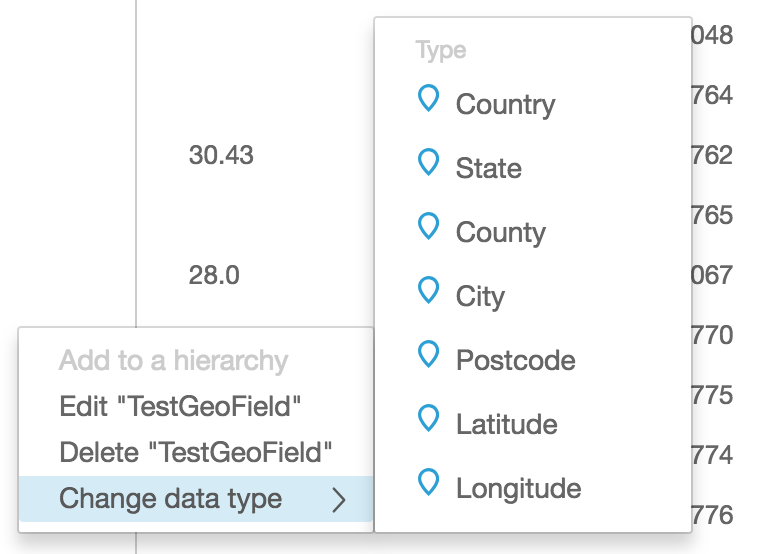
It’s clear what the data means, but for Amazon QuickSight to plot it on a map, it needs to have this coordinate expressed in the correct type – in this case a Geo coordinate.
As I mentioned before, we can use a QuickSight calculated field to solve this problem. This time the formula we need is a little more complex but in essence we are going to split the string into 2 and use one part for a Latitude Geo Coordinate and the other for a Longitude Geo Coordinate.
Here’s the calculated field formula for the Latitude
These calculated fields will be numbers to start with, we still need to tell QuickSight that we want to treat these as coordinates suitable for mapping, so use the edit data type feature to convert them to the appropriate Geo type like this.
Once you have Latitude and Longitude fields, you’ll be able to visualise them on the map charts built in to QuickSight.
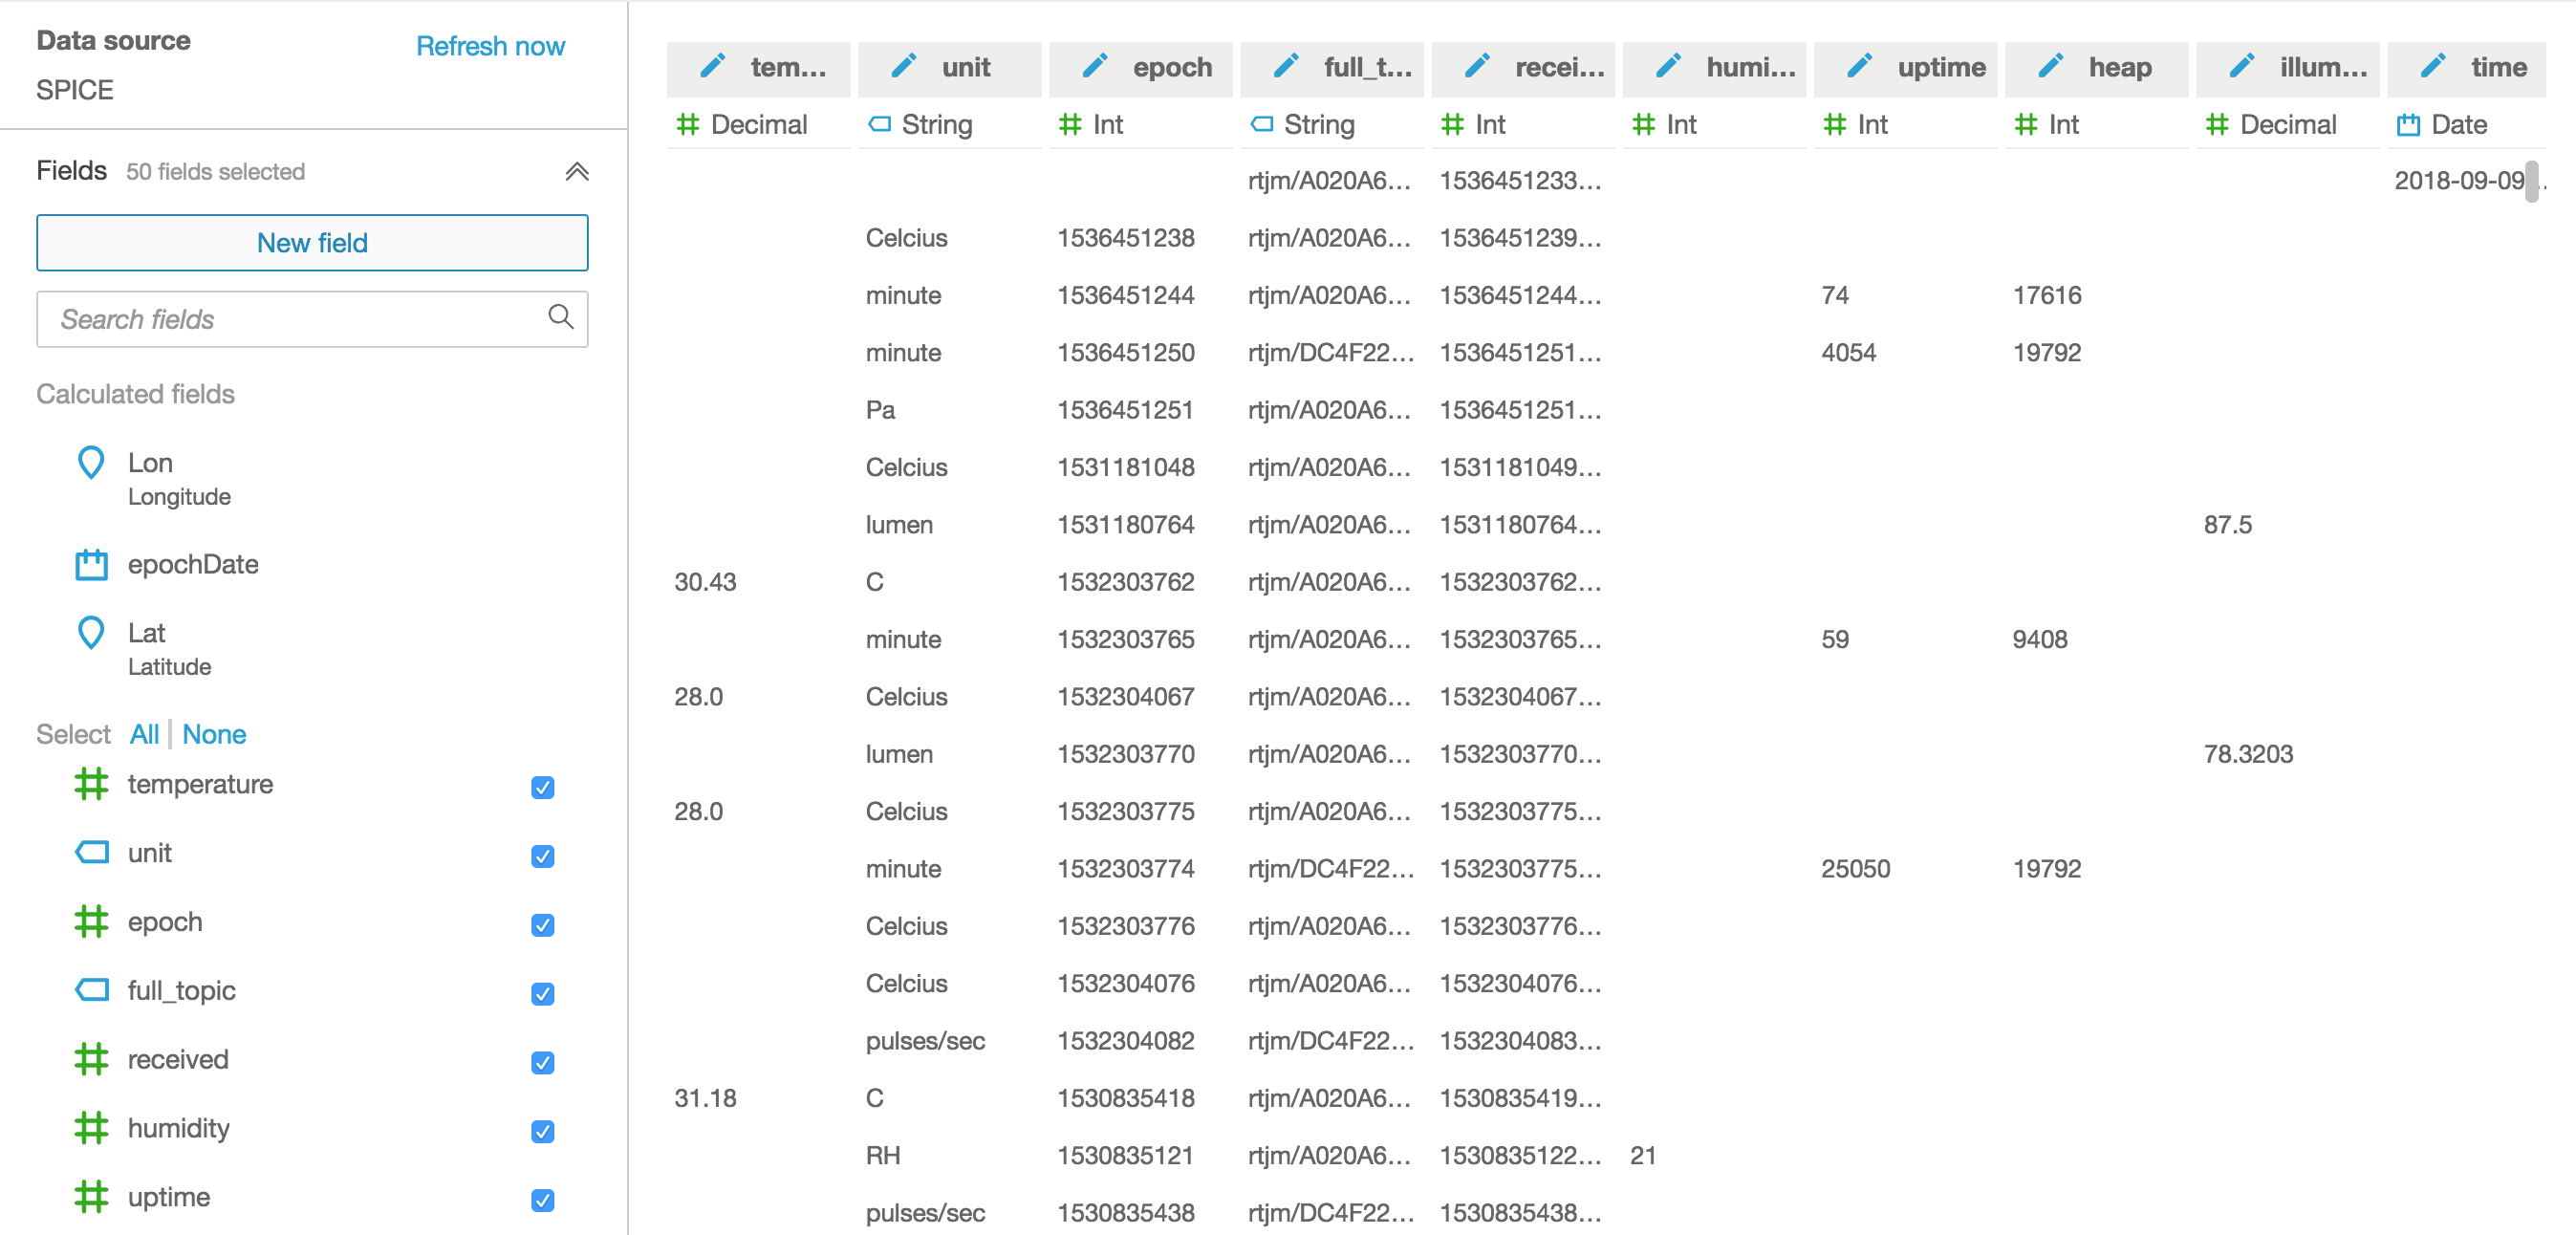
It’s not uncommon for IoT Devices to send timestamp information in simple integers like a unix timestamp or epoch. For example, the time of 10/08/2018 @ 1:05am (UTC) is represented by the epoch 1538960714 which is the number of seconds since Jan 1st 1970. Sometimes we might also have this in milliseconds, such as when we use an IoT Core Rule to add a timestamp to the incoming message.
If I have an AWS IoT Analytics Data Set containing epoch seconds or milliseconds, I’ll find it difficult to use that data effectively in Amazon QuickSight which really needs to have a date type column in order to consider it as a time. What to do?
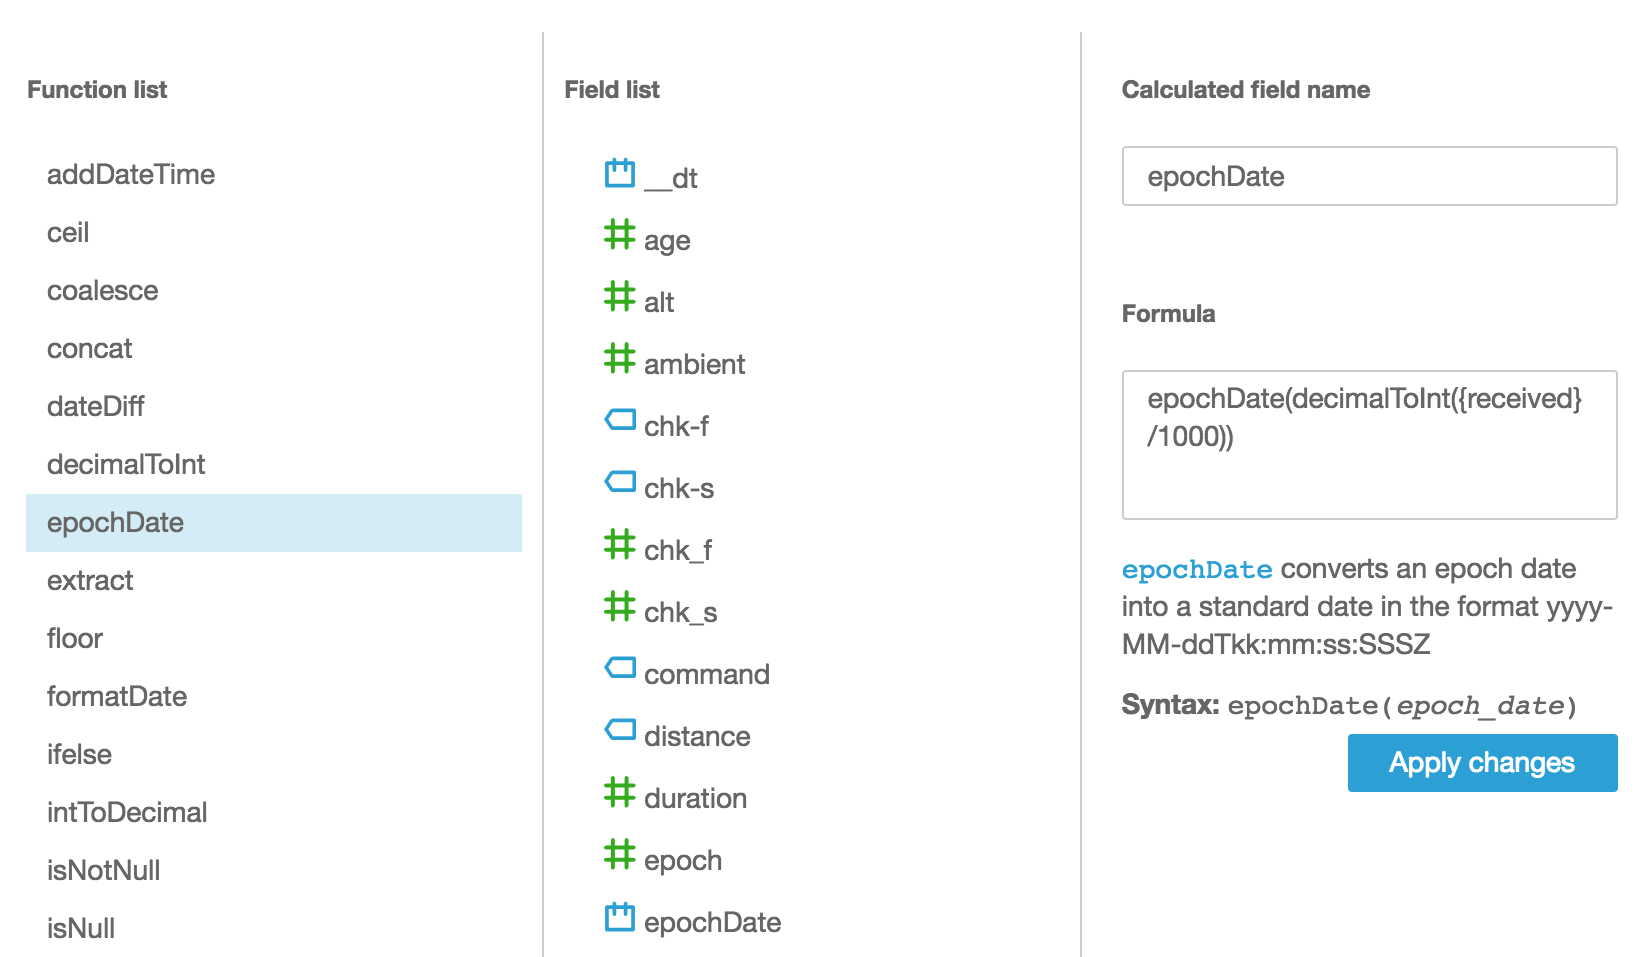
This is where QuickSight’s ability to have calculated fields comes to the rescue.
Click on New field and then give your new field a name such as epochDate. Then you want to use the epochDate built in function to convert your epoch seconds or milliseconds data into the right format.
In this example my messages contain a field called received which is in epoch milliseconds, and so I’m dividing that by 1000, converting the result to an integer (required by the epochDate function) and then returning the result of the epochDate() function.
When you create a Data Set with IoT Analytics, the default SQL query that is shown in the SQL editor is something like this;
SELECT * FROM datastore
Whilst there’s nothing wrong with this as a starting point, it’s important to realise that an unconstrained query like this will do a full table scan of your data every time it is executed. That may be OK if you have a short retention period configured for your datastore and you only have a few thousand messages, but imagine having terabytes of data stretching back over years and really you only want to get data for the last few days? The query above may work (it may also time out), but it’s vastly inefficient and you’ll be paying for the privilege of scanning the entire data store every time.
There is a better way.
Your first starting point should always be to use a WHERE clause referencing the system provided __dt column. For ‘dt’, think ‘datetime’ because it is this column that gives you access to the time based partitions that help you make queries on IoT Analytics and the double underscores are used to avoid clashes with any attribute names in your own data.
Here’s an example that just looks at data from the past day.
select * from telescope_data where __dt >= current_date - interval '1' day
__dt has a granularity of 1 day so if you want to look at a narrower time-range, you would add a constraint on whatever timestamp column you had in your data, but always, always, always include the __dt constraint as part of your where clause to maximise query performance and lower query cost.
For example, what if we just want data from the last 15 minutes in our query results?
select * from telescope_data where __dt >= current_date - interval '1' day
and from_unixtime(epoch) > now() - interval '15' minute
Notice that we have the __dt clause to restrict data to the most recent day and then have a clause based on the epoch reported in each message to further restrict to the last 15 minutes.
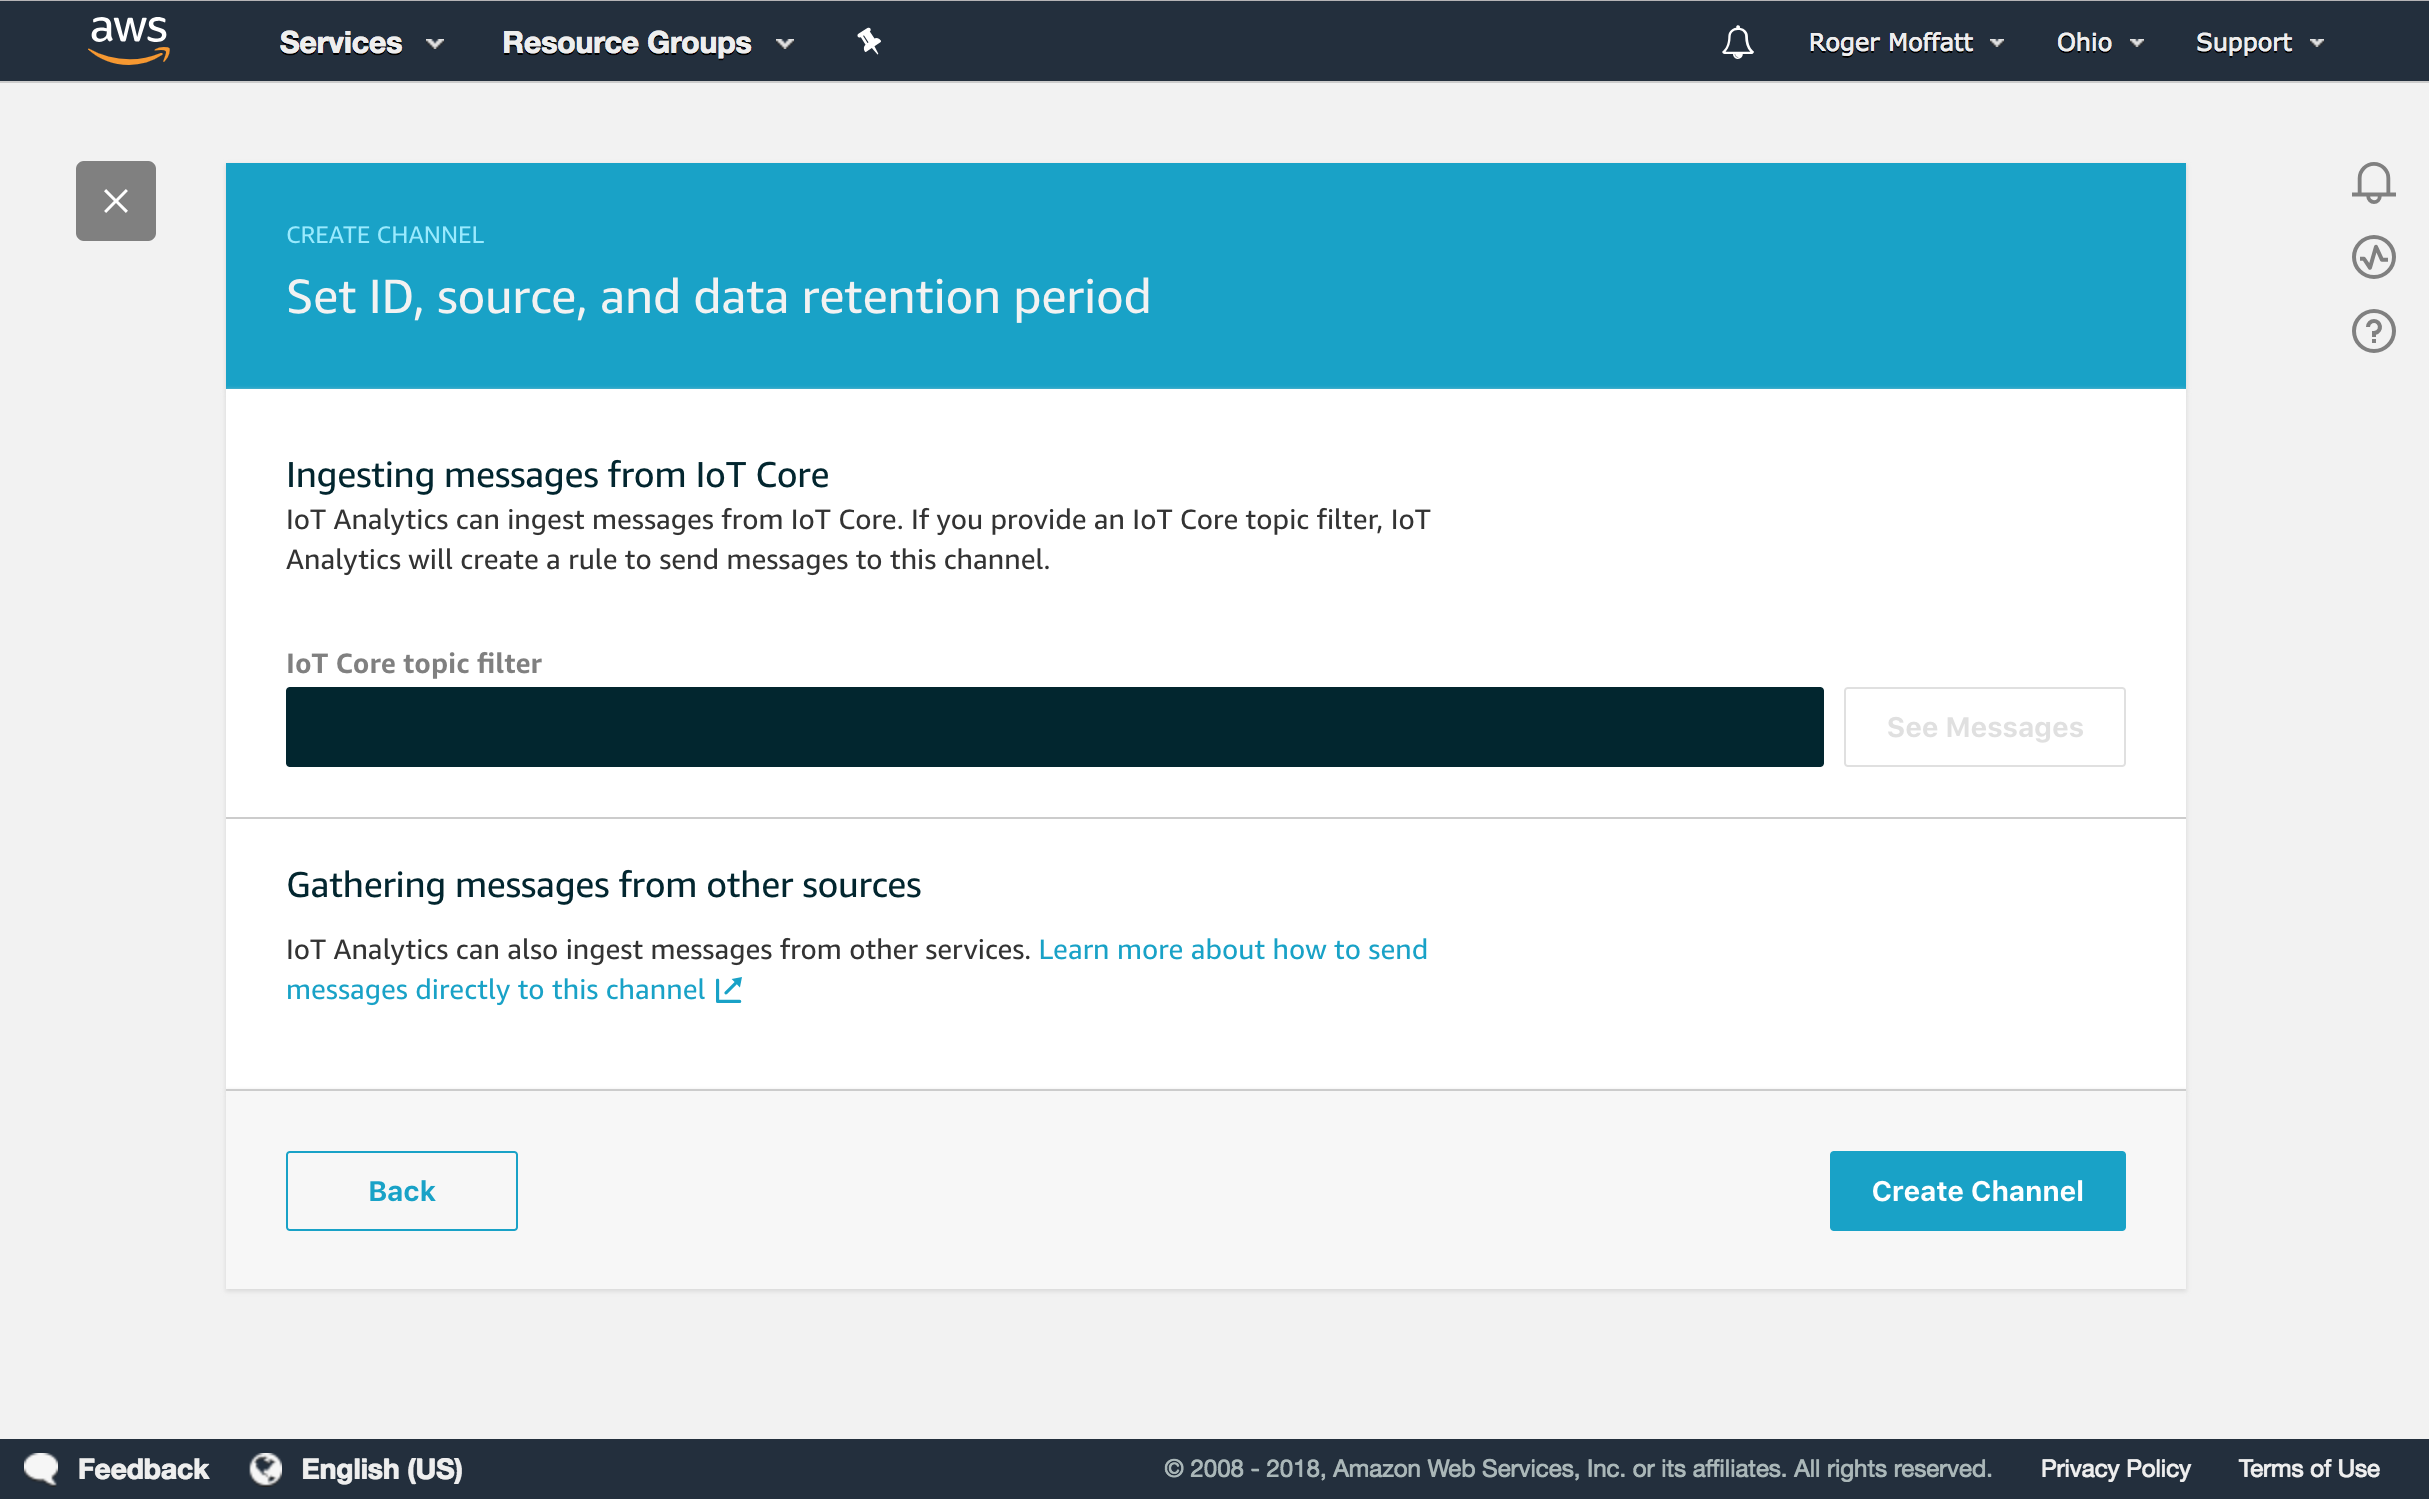
The Create Channel workflow in the IoT Analytics Channel encourages you to specify an MQTT Topic Filter to listen for messages – but did you realise this is completely optional?
Just click directly on the Create Channel button without entering anything on this page and the Rule won’t be created for you. You can choose to setup a Rule later in the IoT Core Console or if you are not using MQTT at all, you can simply send your data to the Channel using the batch-put-message API from the programming language of your choice.