The basic solution we’re going to build here is as follows (see part one for more information)
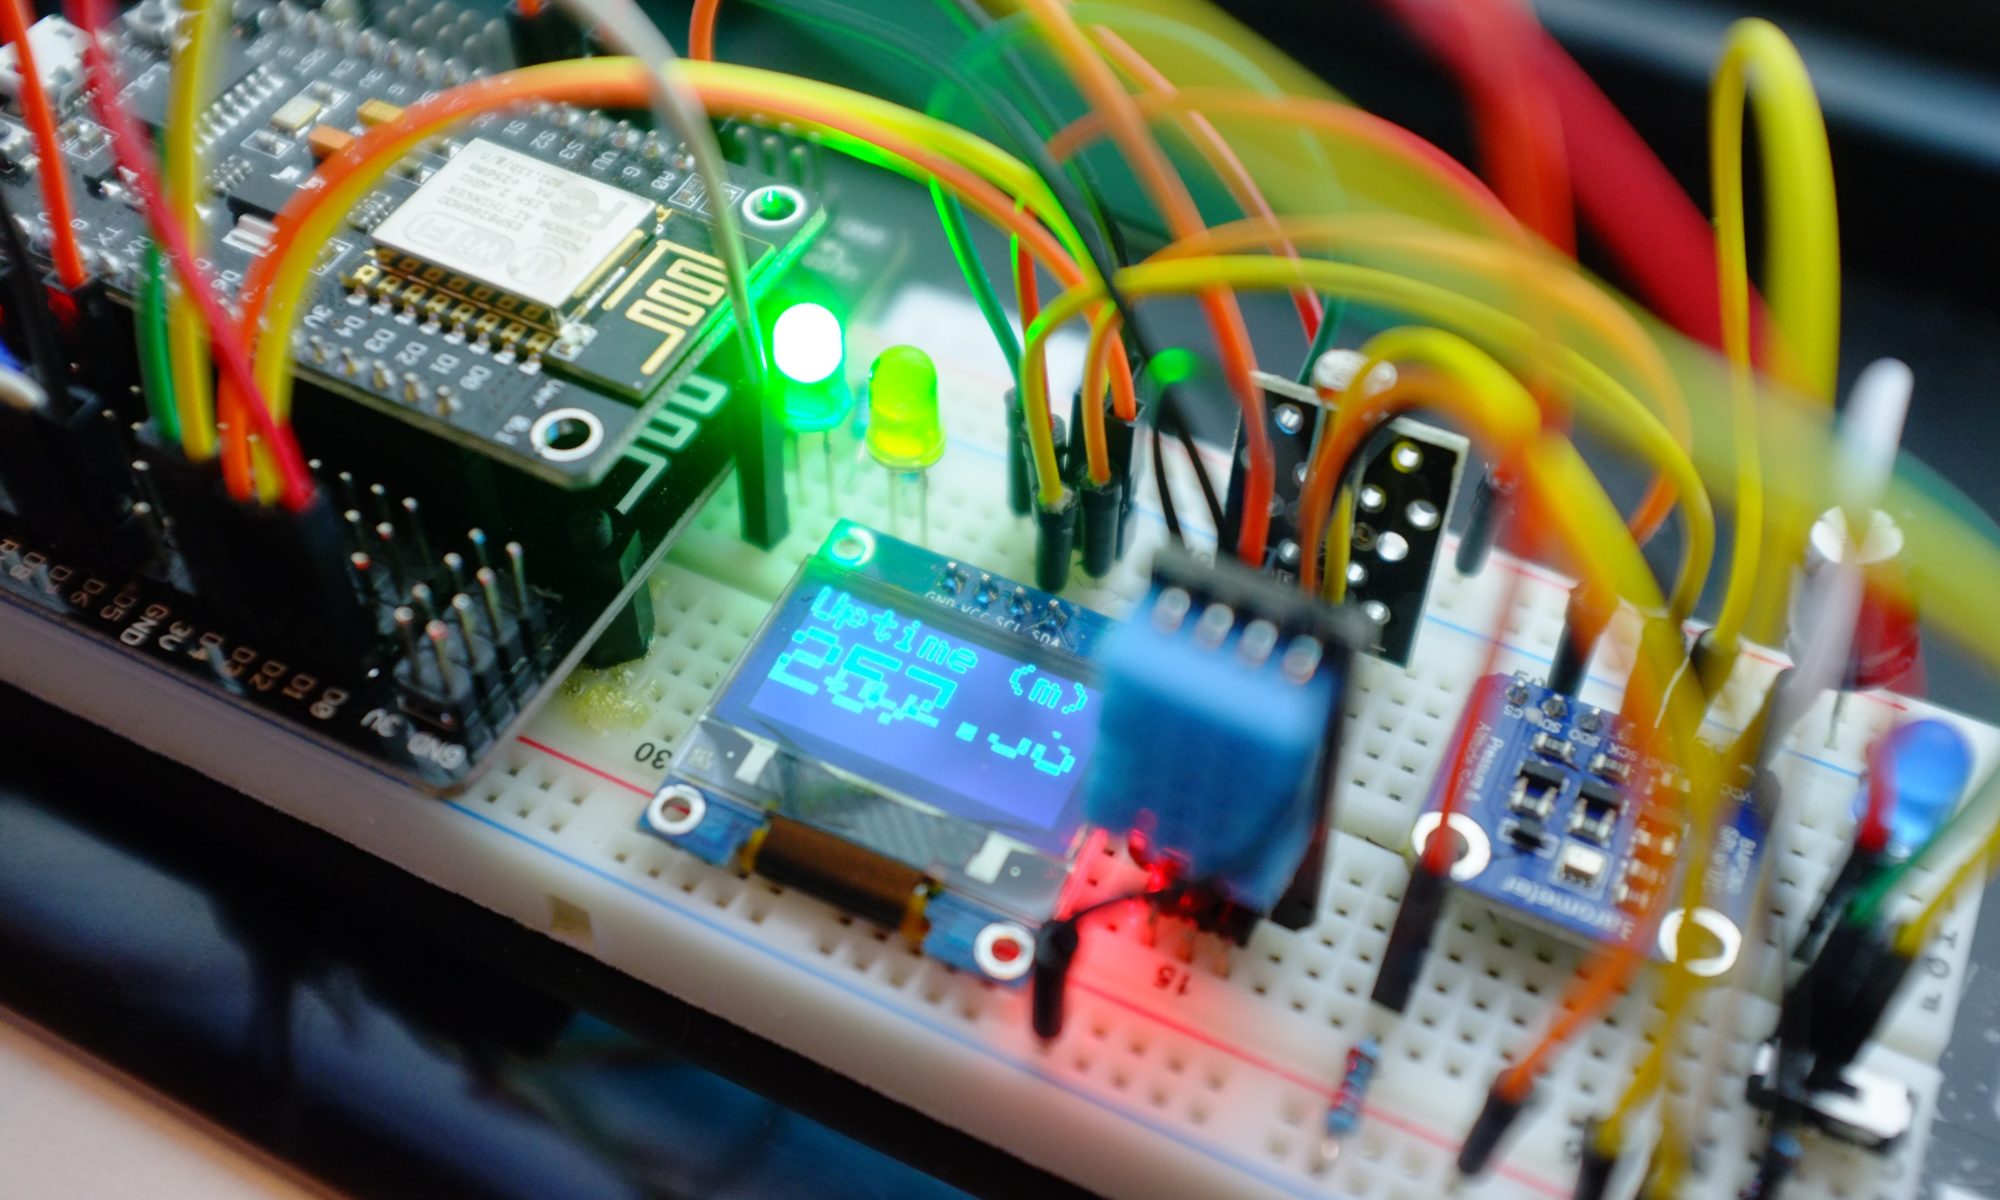
1) Build the project into a box using an ESP8266 and a VL53L0X time of flight sensor.
2) Send array of 320 distance measurements for any 16 second period where someone may have crossed the laser. Why 320? arbitrary, I was plotting the moving average on a TFT screen in version 1 and it had 320 pixels across …
3) Data is sent to AWS IoT Core and then a Rule Engine Action sends to AWS IoT Analytics.
4) Every hour, run a query on IoT Analytics to pull the last 14 days of measurement data. Doesn’t have to be 14 days, or run every hour, but that’s what I’m using.
5) Trigger a container dataset that executes the custom analysis when the SQL dataset has completed, this is the Jupyter notebook that will parse the data extracted in 4) and determine if we need to alert anyone about the cats or not.
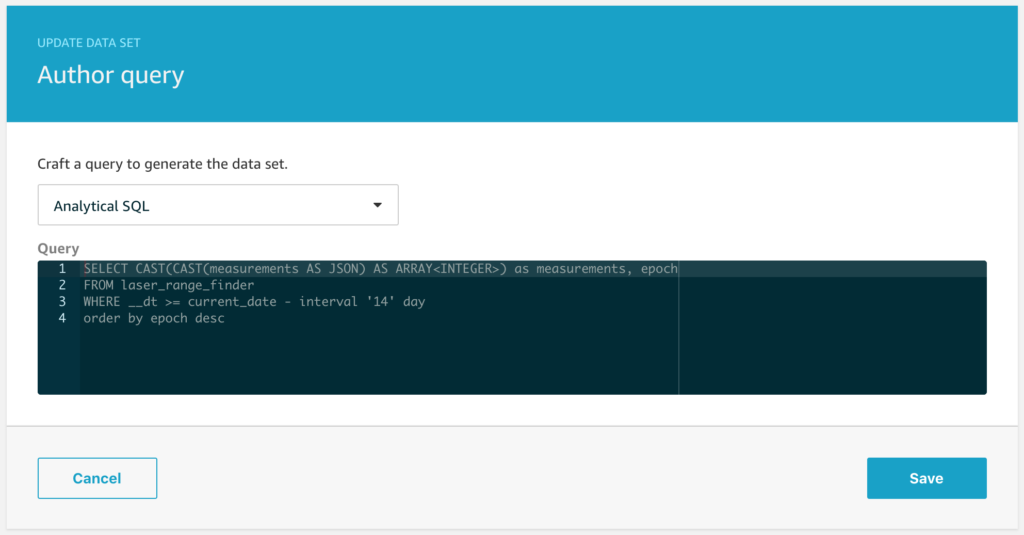
The SQL query for (4) looks like this;

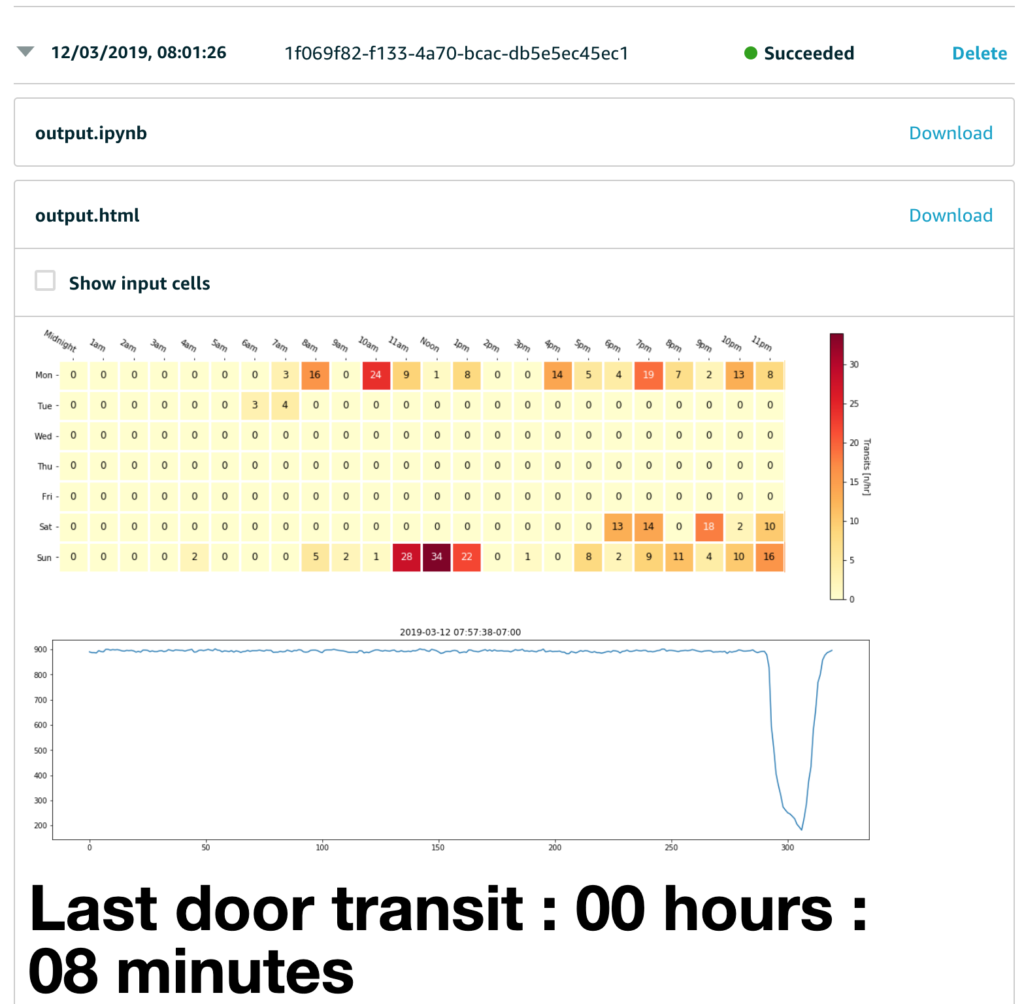
The output from the notebook, which shows a heat map of activity along with the most recent door crossing looks like this;

