Last time we saw how we could take the the results of our cloud sensor data set and explore them using a Jupyter notebook. Typically you use the notebook to implement the data science part of your projects but once you have the notebook ready, how do you run it automatically on a schedule?
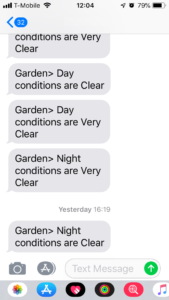
First let’s start with the data science we would like to do. I’m going to do some analysis of my sensor readings to determine if it is night or day and if the sky is clear, has low or high cloud, or it’s raining (or snowing). Then, if conditions have changed since the last update, I’m going to publish a message on an SNS topic which will result in a message on my mobile phone for this example.
The first new feature I’m going to use is that of delta windows for my dataset.
In the last example, I scheduled a data set every 15 minutes to retrieve the last 5 days of data to plot on a graph. I’m going to narrow this down now to just retrieve the incremental data that has arrived since the last time the query was executed. For this project, it really doesn’t matter if I re-analyse data that I analysed before, but for other workloads it can be really important that the data is analysed in batches that do not overlap and that’s where the delta window feature comes in.
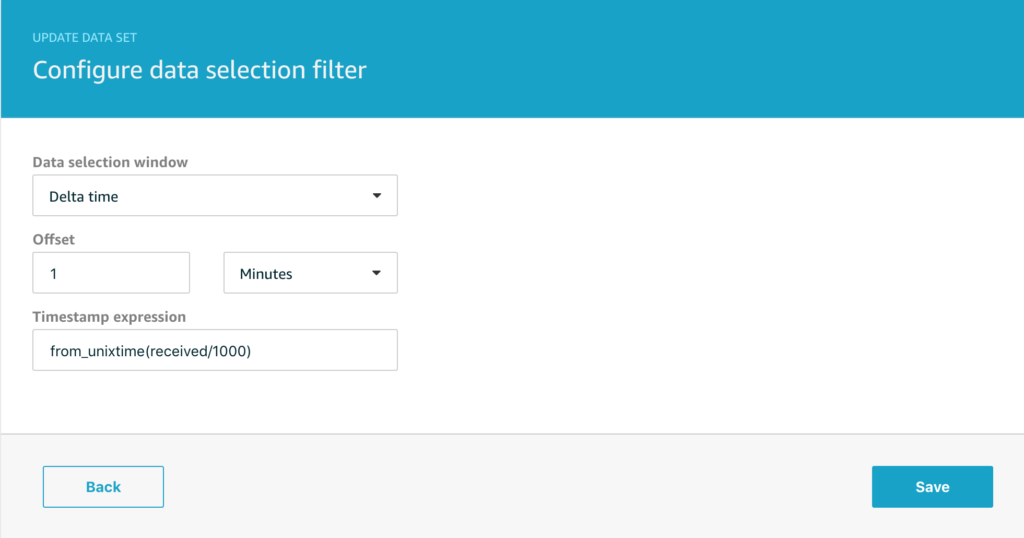
We will edit the data set and configure the delta time window like this;
The Timestamp expression is the most important option, IoT Analytics needs to know how to determine the timestamp of your message to ensure that only those falling within the window are used by the data set. You can also set a time offset that lets you adjust for messages in flight when the data set is scheduled.
Note that my Timestamp expression is;
from_unixtime(received/1000)
In many of my projects I use the Rule Engine Action SQL to add a received timestamp to my messages in case the device clock is incorrect or the device simply doesn’t report a time. This generates epoch milliseconds hence I’m dividing by 1000 to turn this into seconds before conversion to the timestamp object.
We’re going to make some changes to our Jupyter notebook as well, to make it easier to see what I’ve done, the complete notebook is available here.
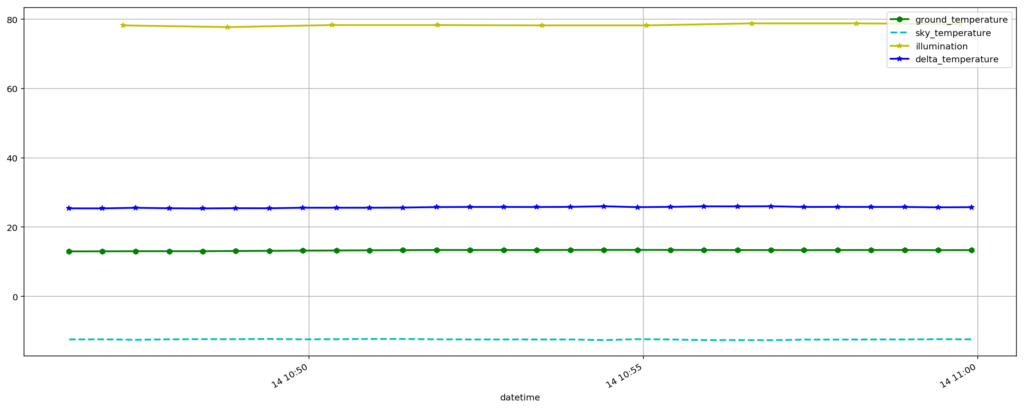
First thing to note is that the delta window with a query scheduled every 15 minutes means we will only have data for a 15 minute window, here’s what a typical plot of that data will look like;
And here’s the ‘data science’ bit – the rules we will use to determine whether it is night or day and whether it is cloudy or not. Obviously in this example we could basically do this in real-time from the incoming data stream, but imagine that you needed to do much more complex analysis … that’s where the real power of Jupyter notebooks and Amazon Sagemaker comes to the fore. For now though, we’ll just do something simple;
mean = statistics.mean(df_delta)
sigma = statistics.stdev(df_delta)

sky='Changeable'

if (sigma < 5 and mean > 20) :
    sky = 'Clear'
if (sigma < 1 and mean > 25) :
    sky = 'Very Clear'
if (sigma < 5 and mean <= 3) :
    sky = 'Rain or Snow'
if (sigma < 5 and mean > 3 and mean <= 10) :
    sky = 'Low cloud'
if (sigma < 5 and mean >12 and mean <= 15) :
    sky = 'High cloud'

mean,sigma,sky
So we’ll basically report Very Clear, Clear, Rain or Snow, Low cloud or High cloud depending on the difference between the temperature of the sky and ground which is a viable measure of cloud height.
We’ll also determine if it is night or day by looking at the light readings from another sensor in the same physical location.
Automation
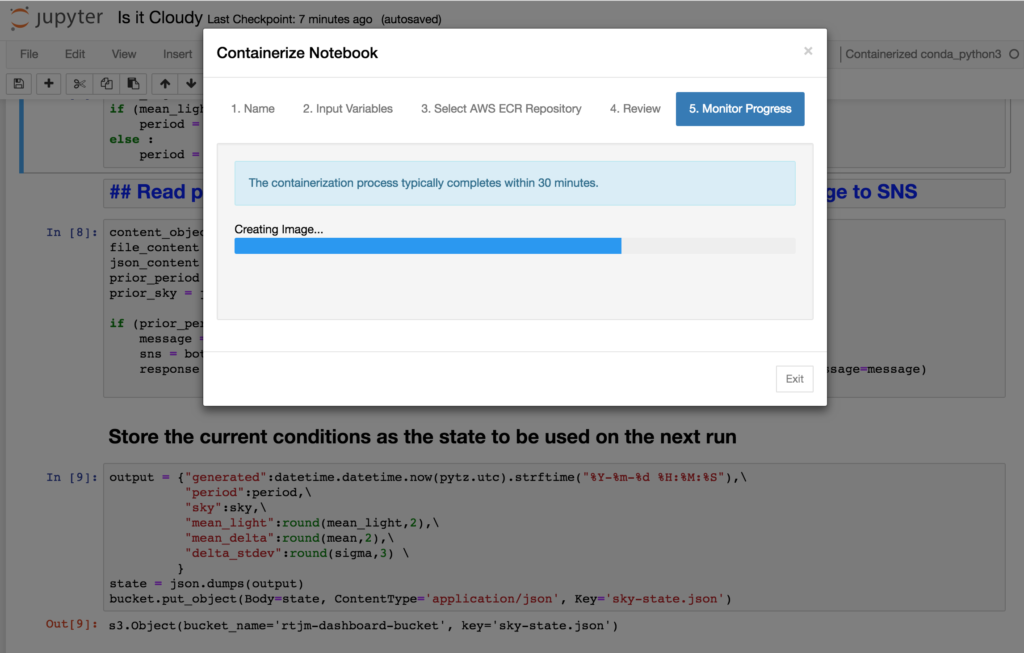
We can test our new notebook by running it as normal, but when we’re ready to automate the workflow we need to containerize the notebook so it can be independently executed without any human intervention. Full details on this process are documented over at AWS
Trigger the notebook container after the data set
Once you’ve completed the containerization, the next step is to create a new data set that will execute it once the SQL data set has completed.
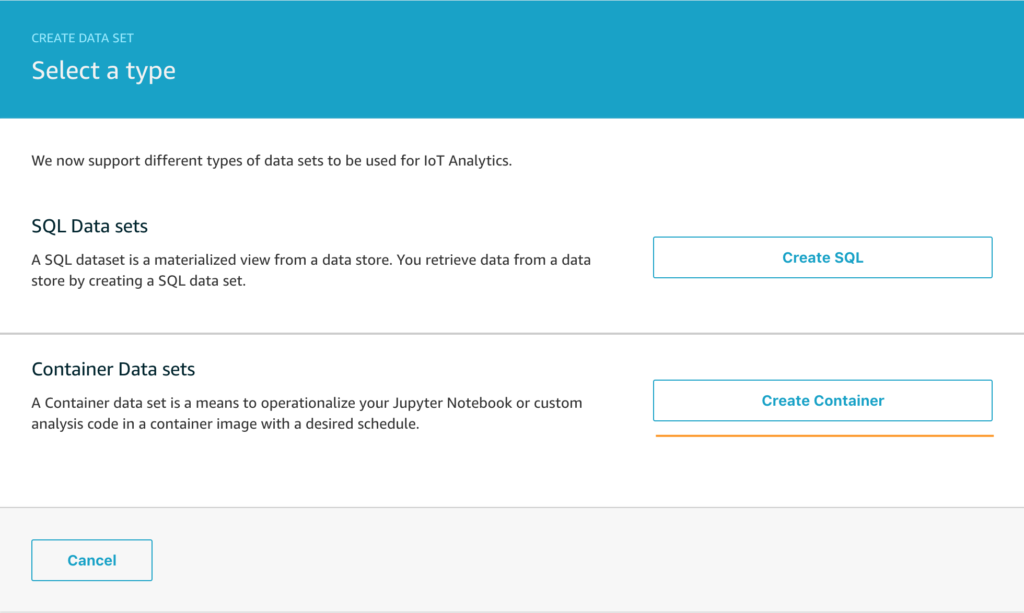
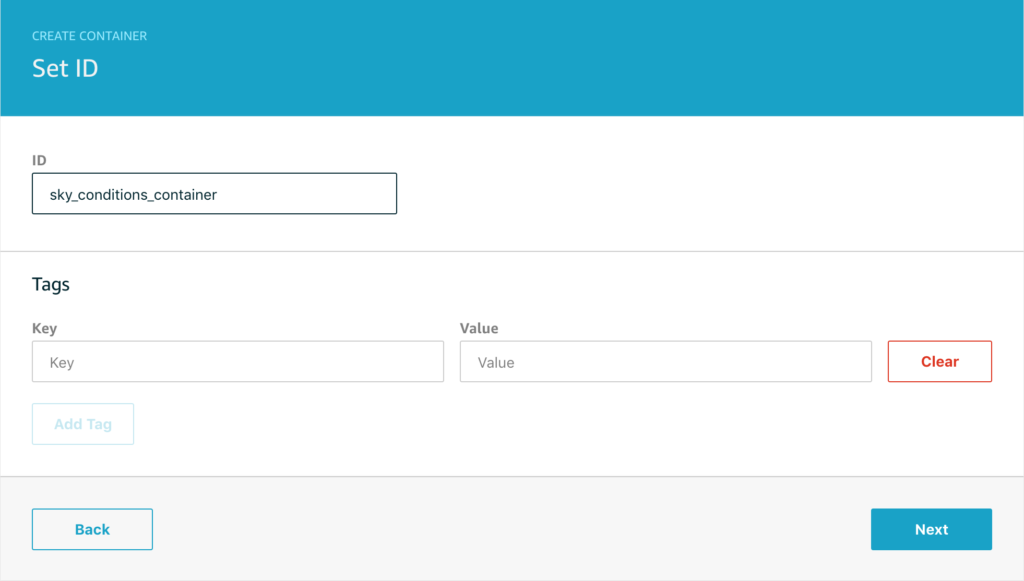
Select Create Container and on the next screen name your data set so you can easily find it in the list of data sets later.
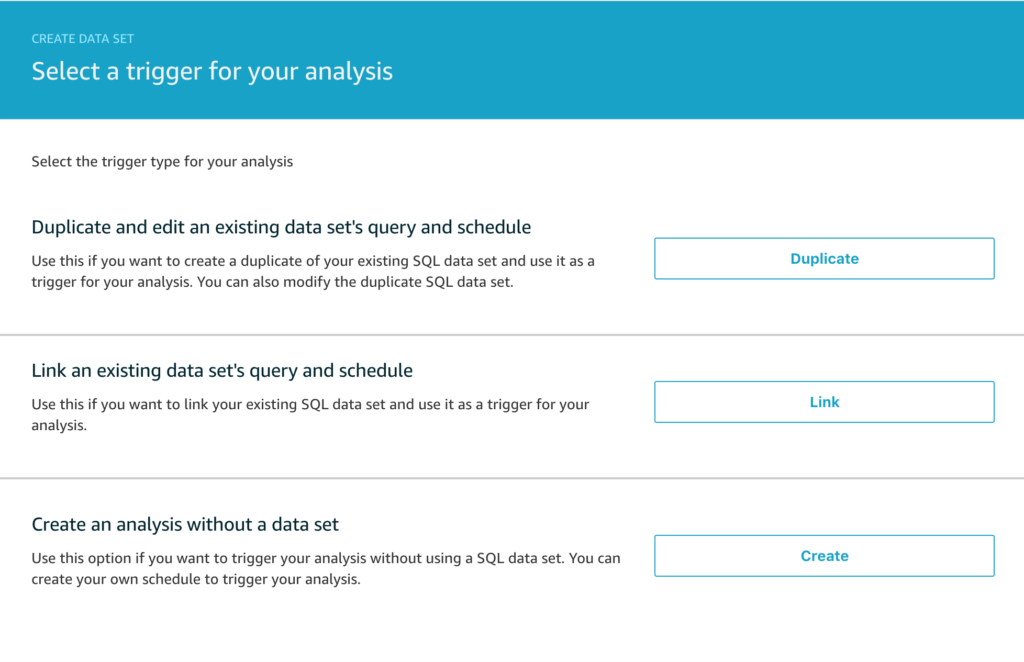
Now you want to select the trigger for the analysis. You don’t have to trigger the container execution from a data set, but it is quite a common workflow and the one we’re going to use today, so click Link to select the trigger from the 3 options below.
Next we have to select which data set we want to link this analysis to.
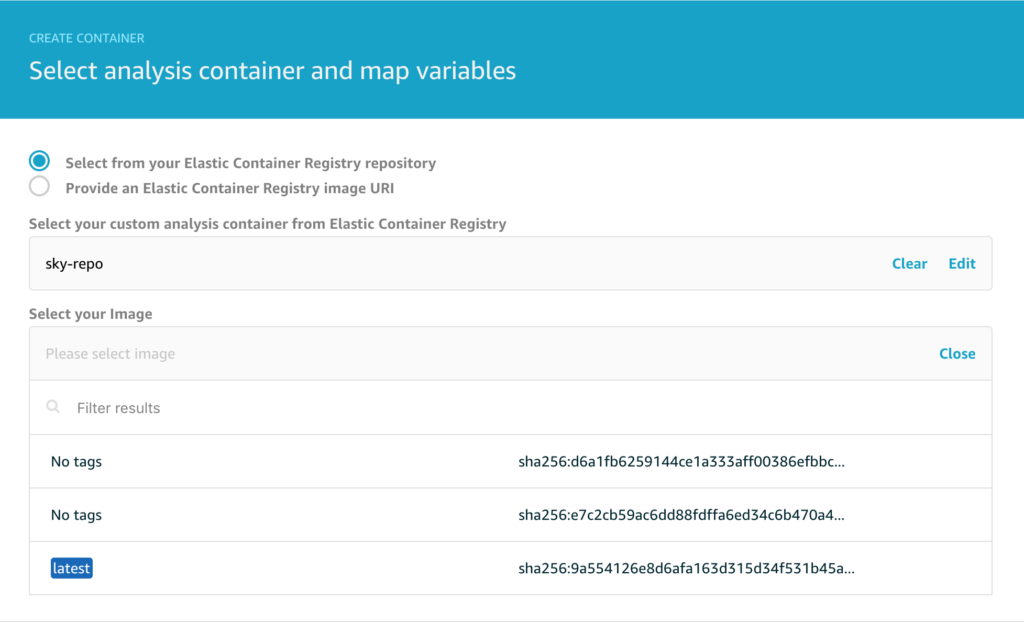
And then we need to configure the source container that will be executed.
Note that you can choose to deploy any arbitrary container from Amazon ECR but we’re going to choose the container we created earlier. Note that the latest image is tagged to help you locate it since typically you will want to run the most recent version you have containerised.
On the next page, note that you can select between different compute resources depending on the complexity of the analysis you need to run. I typically pick the 4 vCPU / 16GiB version just to be frugal.
The final step is to configure the retention period for your data set and then we’re all set.
Although there are a lot of steps, once you’ve done this a couple of times it all becomes very straight-forward indeed. We now have the capability to execute a powerful piece of analysis triggered by the output of the SQL data set and do this entire workflow on a schedule of our choosing. The automation possibilities this opens up are significant and go beyond my simple example of sending me a message when the weather changes locally.
