IoT Analytics is great for doing analysis of your IOT device data on a regular cadence, for example daily or hourly. Faster scheduled analysis is possible, and the minimum scheduling frequency was lowered to 15 minutes in August this year, but what if you want something near real-time? Although there isn’t a built in feature for this, if you just want to setup a basic alarm or build some straightforward near real-time dashboards, there’s a simple solution using the power of the IoT Analytics Lambda Activity coupled with AWS CloudWatch.
Messages from my devices flow into AWS IoT Analytics from a number of MQTT topics that are all routed to a Channel using Rules that I’ve setup with AWS IoT.
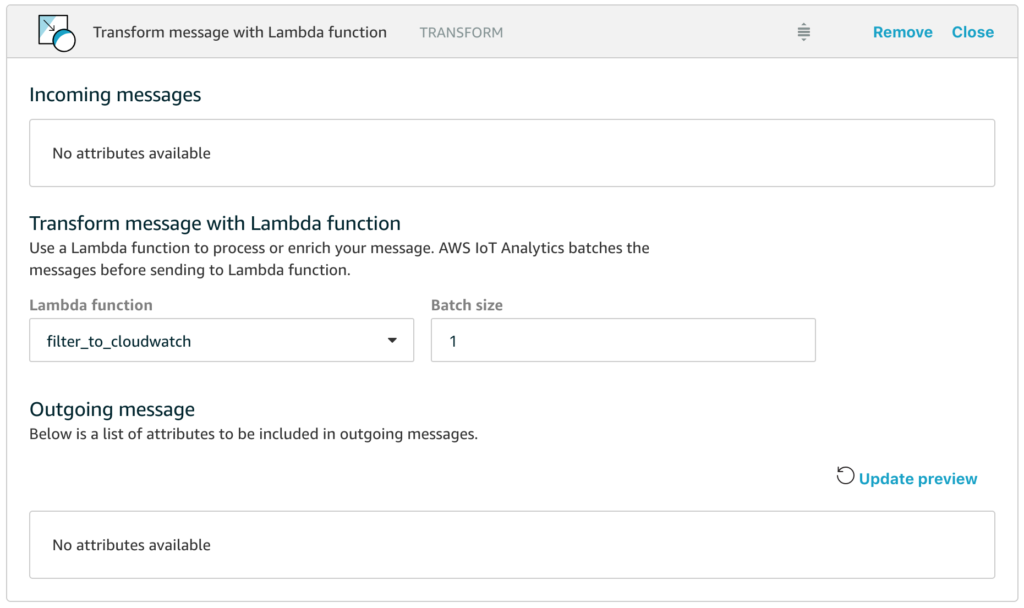
Data flowing into a Channel passes through a Pipeline before reaching the Datastore and this Pipeline is the key to getting our near real-time metrics.

All we have to do is add a Lambda function into our Pipeline and have the Lambda function route appropriate data to AWS CloudWatch so that we can then use all the features of CloudWatch for building our dashboards, configuring alarms and combining our new custom metrics with data from other sources. In the example above, I’ve named the Lambda function filter_to_cloudwatch and let’s take a closer look at how simple this function can be.
import json
import boto3

def cw(topic,value,name):
 cloudwatch = boto3.client('cloudwatch')
 cloudwatch.put_metric_data( MetricData=[
 {
  'MetricName': name,
  'Dimensions': [{'Name': 'topic','Value': topic}],
  'Unit': 'None',
  'Value': value
 }],Namespace='Telescope/Monitoring-Test')
 return

def lambda_handler(event, context):
 for e in event:
  if 'uptime' in e :
   cw(e["full_topic"],e["uptime"],"uptime")
  if 'illumination' in e :
   cw(e["full_topic"],e["illumination"],"illumination")
  if 'temperature' in e :
   cw(e["full_topic"],e["temperature"],"temperature")
 return event
Yes, that is all of the code, it really is that short.
Hopefully the code is self-explanatory, but in essence what happens is that the Lambda function in a Pipeline is passed an array of messages with the size of the array dependent on the batch size that you configure for the activity (the default of 1 means that the Lambda function will be invoked for each individual message, which is fine for scenarios where messages only arrive in the channel every few seconds).
The handler then loops through all the messages and looks to see if the message has attributes for uptime, illumination or temperature – these are the attributes that I want to graph in near real-time in this example. If the attribute exists in the message, we call the cw() function to emit the custom metric to AWS CloudWatch.
Note that the Lambda function simply returns the messages that it received so that they flow through the rest of the Pipeline.
Probably the biggest gotcha is that you need to make sure you have granted IoT Analytics permission to invoke your Lambda function, and you can do this with the following simple AWS CLI command.
aws lambda add-permission --function-name filter_to_cloudwatch --statement-id filter_to_cloudwatch_perms --principal iotanalytics.amazonaws.com --action lambda:InvokeFunction
If you forget this, and you have configured your logging options, you’ll see error messages like this for your cloudwatch log stream aws/iotanalytics/pipelines
[ERROR] Unable to execute Lambda function due to insufficient permissions; dropping the messages, number of messages dropped : 1, functionArn : arn:aws:lambda:us-west-2:<accountid>:function:filter_to_cloudwatch
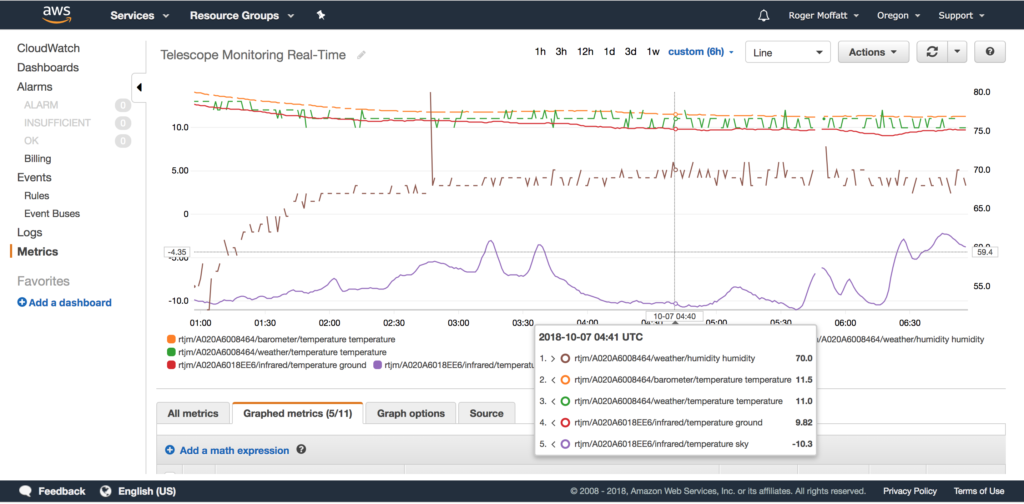
And that’s it! We can now use all the loveliness of AWS CloudWatch to plot our custom metrics on graphs and dashboards with fine grained time resolution, for example this is a graph of my data every 30 seconds.

In conclusion, we’ve seen that with a little lateral thinking, we can leverage the Lambda Activity that is available in the AWS IoT Analytics Pipeline to route just the message attributes we want to a near real-time dashboard in AWS CloudWatch.
Happy Dashboarding!
