
We discussed previously how to get data out of your data store by writing SQL queries to produce data sets in CSV format. What about exploring and visualising that data to make insights easier? In this post I’ll talk about the native integration between AWS IoT Analytics and Amazon QuickSight that makes this possible and fun.
First, let’s take a quick look at one of my dashboards.

This shows a variety of data about some of the sensors located in our garden (the locations on the map are not real) and as you can see it does a decent job of visualising the data at hand – but where does that data actually come from?
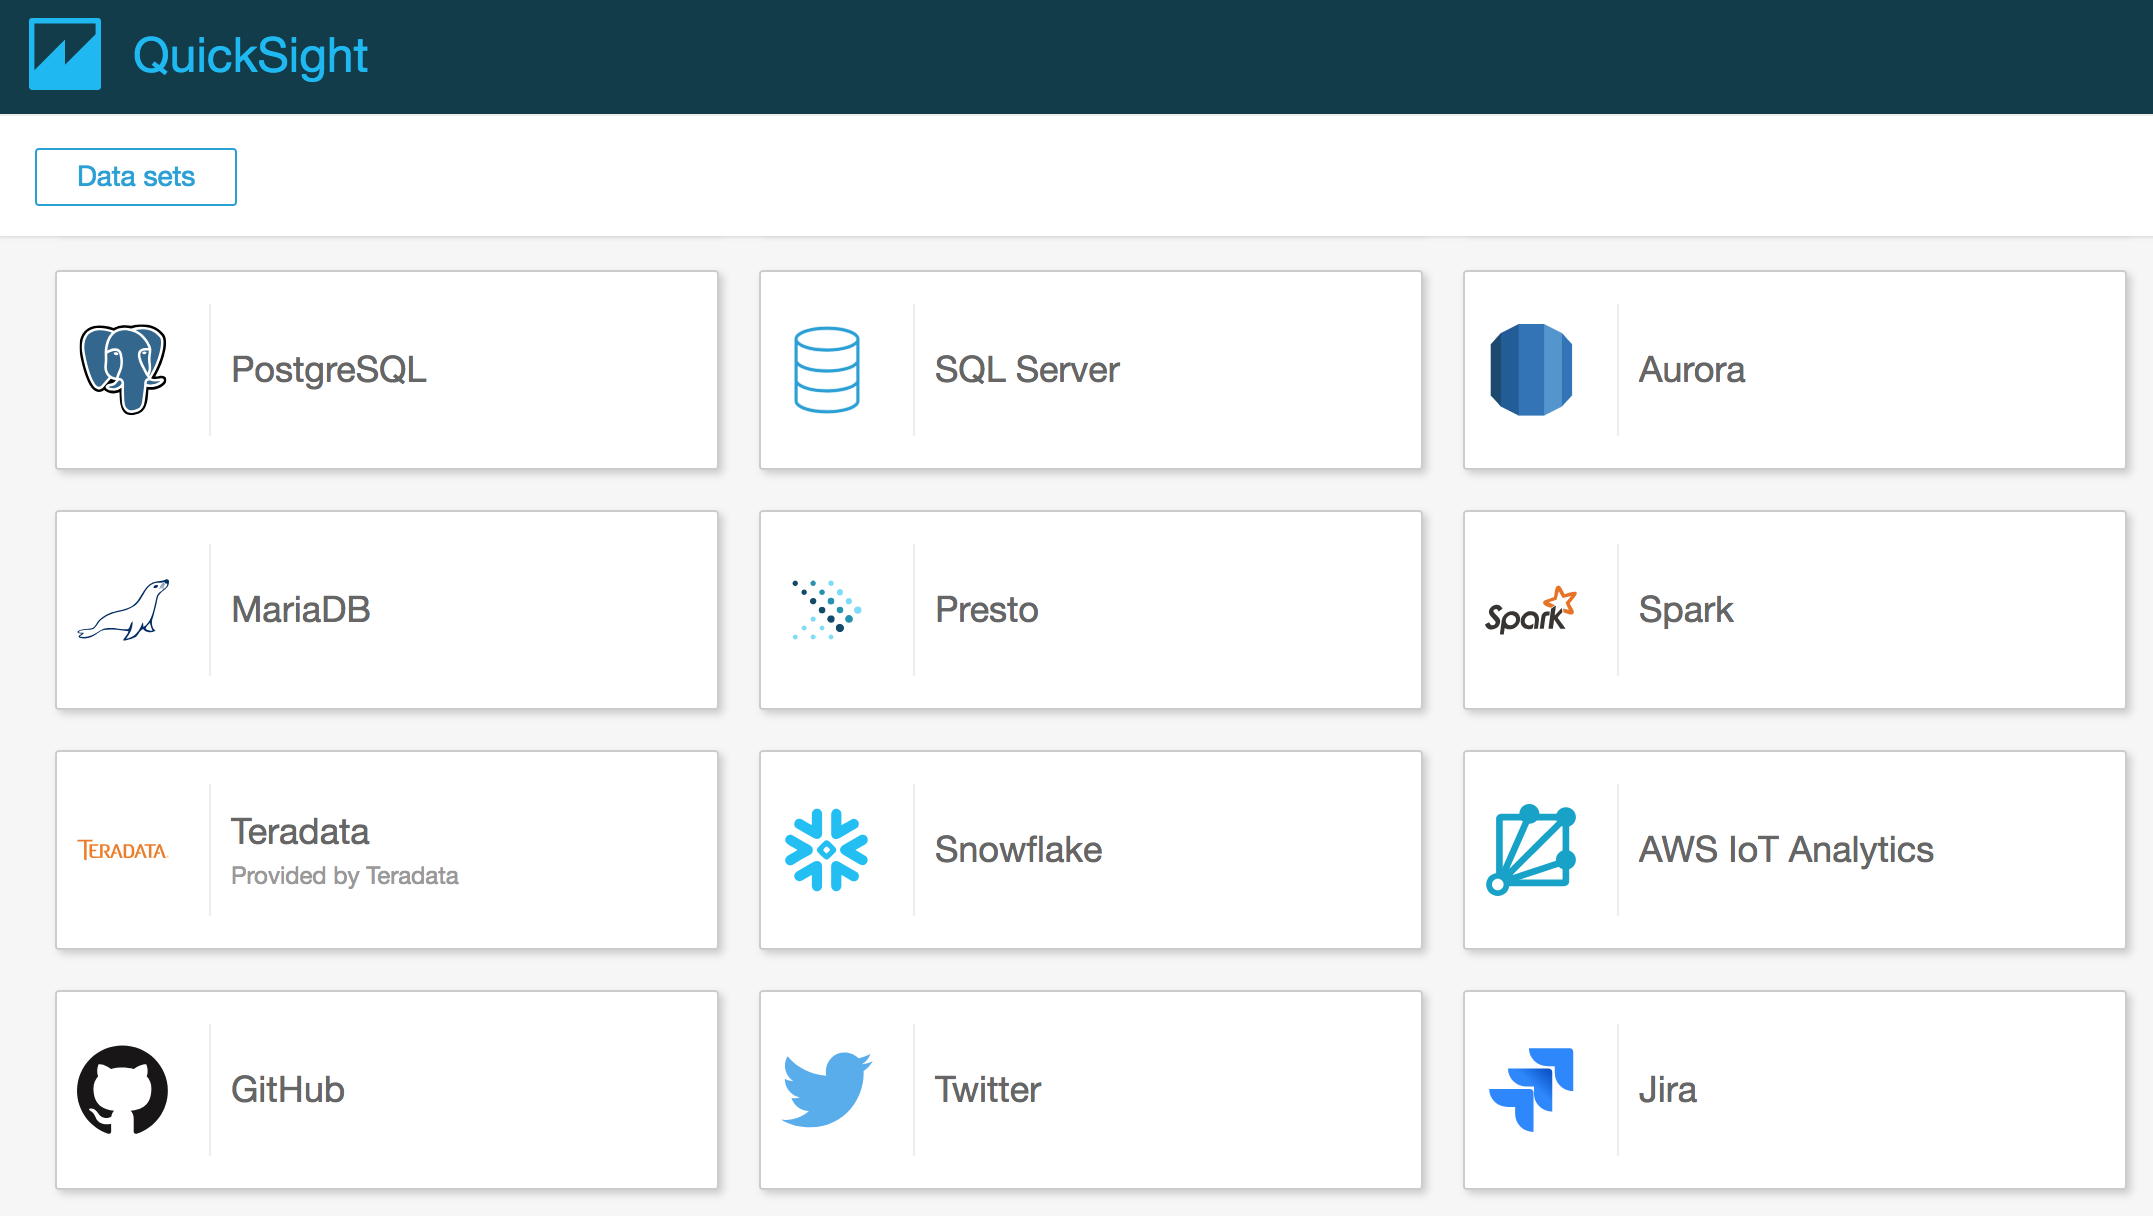
QuickSight has native support for AWS IoT Analytics Datasets and so your starting point is to create a new QuickSight Dataset using the Data Source selection page that looks like this.
Once you’ve selected a data set in IoT Analytics (remember, a data set is the result of a SQL query against the data store) you have some pretty nice data preparation tools in QuickSight that let you alter column types and even create new calculated columns – and this is an especially useful feature as you can, for example, take a unix timestamp and convert it into a date time object that QuickSight can use as the x-axis on many of your graphs. I wrote more about this here.